
Donoghue Forlines Dividend VIT Fund
Fund Goal
The Fund’s primary investment objective is total return from dividend income and capital appreciation. Capital preservation is a secondary objective of the Fund.
Potential Benefits
- Seeks Income & Growth by investing in quality stocks carrying high dividend yield
- Invests in a diversified mix of sectors to reduce volatility
- Employs tactical overlays to attempt to potentially reduce significant market drawdowns
*There is no guarantee that any investment strategy will achieve its objectives, generate profits, or avoid loses.
*There is no guarantee that underlying holdings will continue to pay dividends.
Index Selection Process
Performance
| Fund Prices & YTD Returns as of June 2, 2026 | Performance Through June 2, 2026 | Average Annual Returns Through December 31, 2025 | ||||||||||
|---|---|---|---|---|---|---|---|---|---|---|---|---|
| NAV | NAV Daily Change | % Daily Change(1) | % YTD Return(2) | One Month | Three Months | Six Months | Since Inception(3) | One Year | Three Years | Five Years | Ten Years | Since Inception(3) |
| DF Tactical Dividend VIT Fund Class 1 | ||||||||||||
| $20.24 | +$0.10 | 0.50% | 10.53% | 0.25% | 0.87% | 13.18% | 4.49% | 17.19% | 9.15% | 8.72% | 3.46% | 4.03% |
| Syntax US LargeCap 500 Total Return Index (USD) | ||||||||||||
| $9,128.30 | +$20.44 | 0.22% | 12.09% | 5.63% | 11.39% | 12.36% | 11.25% | 18.17% | 23.67% | 14.11% | 15.02% | 10.84% |
| Syntax US Net Value Total Return Index (USD) | ||||||||||||
| $6,933.43 | +$20.46 | 0.30% | 10.03% | 1.21% | 2.40% | 12.70% | 8.76% | 16.76% | 14.96% | 13.91% | 11.79% | 8.41% |
- Represents the percentage increase/decrease in the net asset value from the prior trading day.
- Performance for periods less than one year is not annualized.
- Inception date is May 1, 2007.
The performance data quoted here represents past performance. Current performance may be lower or higher than the performance data quoted above. Past performance is no guarantee of future results. The investment return and principal value of an investment will fluctuate so that investor’s shares, when redeemed, may be worth more or less than their original cost. Please review the fund’s prospectus for more information regarding the fund’s fees and expenses. For performance information current to the most recent month-end, please call toll-free 877-779-7462.
The fund is an investment vehicle for variable annuity contracts and may be subject to fees or expenses that are typically charged by these contracts. Please review the insurance contract prospectus for further description of these fees and expenses. This product is available as a sub-account investment to a variable life insurance policy only and is not offered directly to the general public. The below table describes the annual operating expenses that you pay indirectly if you invest in the Fund through your retirement plan or if you allocate your insurance contract premiums or payments to the Fund. However, each insurance contract and separate account involves fees and expenses that are not described here. If the fees and expenses of your insurance contract or separate account were included in this table, your overall expenses would be higher. You should review the insurance contract prospectus for a complete description of fees and expenses.
Annual Operating Expenses
(expenses that you pay each year as a percentage of the value of your investment)
| Expense | Class 1 Shares |
|---|---|
| Management Fees | 1.00% |
| Distribution & Shareholder Service (12b-1) Fees | 0.25% |
| Other Expenses | 1.51% |
| Total Annual Fund Operating Expenses(1) | 2.76% |
| Fee Waiver and/or Expenses Reimbursement | (0.76)% |
| Total Annual Fund Operating Expenses After Fee Waiver and/or Expense Reimbursment | 2.00% |
(1) Donoghue Forlines LLC (the “Adviser”) has contractually agreed to waive management fees and/or to make payments to limit Fund expenses, at least until October 31, 2026, so that the total annual operating expenses (exclusive of certain items enumerated in the Fund’s prospectus) of the Fund do not exceed 2.00% of the Fund’s average daily net assets attributable to the Fund’s Class 1 Shares.
Fund Distributions
| Record Date | Ex-Dividend | Payable Date | Amount | |
|---|---|---|---|---|
| Class 1 | ||||
| March 27, 2026 | March 30, 2026 | March 31, 2026 | 0.0719 | |
| September 26, 2025 | September 29, 2025 | September 30, 2025 | 0.0725 | |
| June 26, 2025 | June 27, 2025 | June 30, 2025 | 0.0779 | |
| March 27, 2025 | March 28, 2025 | March 31, 2025 | 0.0619 | |
| November 14, 2024 | November 15, 2024 | November 18, 2024 | 0.0793 | |
| September 26, 2024 | September 27, 2024 | September 30, 2024 | 0.0475 | |
| June 26, 2024 | June 27, 2024 | June 28, 2024 | 0.0581 | |
| March 26, 2024 | March 27, 2024 | March 28, 2024 | 0.0558 | |
Index Selection Process Details
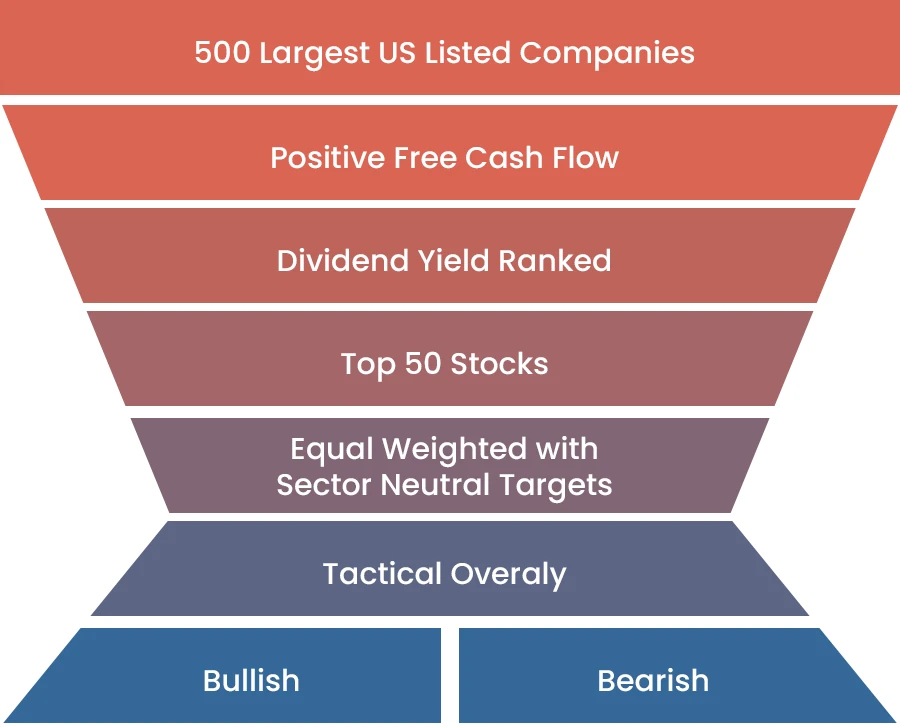
The Donoghue Forlines Dividend VIT Fund (the Fund) is a rules-based strategy that tracks a proprietary index identified in the Fund’s prospectus. The Fund employs a disciplined investment selection process with tactical overlays that determines whether it will be in a bullish (invested) or defensive position.
The tactical overlays are made up of two triggers and are applied to the Syntax US Net Value Total Return Index. The first trigger tracks exponential moving averages of the the aforementioned index to identify potentially negative longer-term trends that more broadly can be indicative of the health of the economy and monitors longer term evolving problems that could lead to bear markets or recessions. The second is an intermediate-term exponential moving average crossover that can potentially identify equity re-entry points. Based on the status of each tactical indicator, the Fund could be 100% in equities or 100% defensive. When in a defensive position, the Fund will invest in short-term U.S. Treasury ETFs or cash equivalents. When bullish, the Fund allocates equally in up to 50 stocks, diversified amongst a market neutral weight of sectors.
The stocks are selected based on having the highest dividend yields in their sector as well as meeting other quality factors. If stocks fail to meet the yield and quality requirements in any sector, only the stocks that meet all the requirements will be included, and the remaining allocation is equally divided between the full final list of selected securities. The sectors used are Financials, Utilities, Healthcare, Energy, Consumer Staples, Real Estate, Materials, Consumer Discretionary, Information Technology, Communication Services, and Industrials.
Additionally, when bullish, the Fund rebalances and reconstitutes annually to bring the holdings back to an equal weighting.
Investment Committee
John A. Forlines, III • Jeffrey R. Thompson • Richard E. Molari
Investment Advisor to the Fund
Donoghue Forlines LLC is a tactical investment firm that has specialized in risk-managed portfolios since 1986. Our tactical strategies are based upon rigorous analysis of decades of historical data. The Donoghue Forlines Funds utilize technical indicators to recognize shifts in market momentum and uses proprietary tactical signals to help mitigate losses in down trending markets and potentially offer strong client-centric risk-adjusted returns over a full market cycle.
Visit the Donoghue Forlines Website
You are about to leave DonoghueForlinesFunds.com and be directed to the Donoghue Forlines website.
Visit Our Website
Donoghue Forlines LLC | 125 High Street, Suite 220 | Boston, MA 02110 | 1.800.642.4276
Investors should carefully consider the investment objectives, risks, charges, and expenses of the Donoghue Forlines Funds. This and other information about the Funds are contained in the prospectus and should be read carefully before investing. The prospectus can be obtained by calling toll free 1-877-779-7462.
The Donoghue Forlines Funds are distributed by Northern Lights Distributors, LLC. Member FINRA / SIPC. Donoghue Forlines LLC is not affiliated with Northern Lights Distributors, LLC.
Important Risk Information
Mutual funds involve risk including the possible loss of principal. The net asset value of the Fund will fluctuate based on changes in the value of the securities in which it invests. The Fund seeks to track a proprietary index that allocates to short-term Treasury ETFs or US Treasury securities based on a defensive indication from technical trends in the exponential moving average of a blend of two fixed income indexes. The exponential moving average is the average of the index’s value over a certain time frame. Diversification does not ensure a profit or guarantee against loss.
Equity Risk
The NAV the Fund will fluctuate based on changes in the value of the equity securities in which it invests equity prices can fall rapidly in response to developments affecting a specific company or industry, or to changing economic, political or market conditions.
Hedging Risk
Hedging strategies may not perform as anticipated by the adviser and the Fund could suffer losses by hedging with underlying money market funds if stock prices do not decline.
Index Construction Risk
The Dividend Index, and consequently the Fund, may not succeed in its objective and may not be optimal in its construction, causing losses to the Fund.
Index Tracking Risk
Investment in the Fund should be made with the understanding that the securities in which the Fund invests will not be able to replicate exactly the performance of the index the Fund tracks because the total return generated by the securities will be reduced by transaction costs incurred in adjusting the actual balance of the securities. In addition, the securities in which the Fund invests will incur expenses not incurred by an index. Certain securities comprising the index tracked by the Fund may, from time to time, temporarily be unavailable, which may further impede the Fund’s ability to track an index.
Definitions
The inclusion of the Syntax US Net Value Index is for comparison purposes only. The Syntax US Net Value Index is a financial index that tracks the net asset value (NAV) of a portfolio. It is a measure of the overall value of the assets held within the index, and it can be used as a benchmark for investment performance or to track a specific investment strategy.
Tactical overlay is a technique that uses trend following technical indicators to modify a portfolio’s risk and return characteristics.
Positive free cash flow indicates that a company’s cash inflows from its operations exceed its cash outflows for both operating activities and capital expenditures.
Dividend Yield is a ratio that demonstrates a company’s annual dividends relative to its shares’ market price.